The full source list held up for a few hours, then fell apart. A week later, only about a third of it was the same.
If you checked your AI visibility once and recorded it, you measured a moment, not a position.
The Claim
Most AI visibility checks rest on one quiet assumption, that when you ask an AI tool something, the answer you see is the answer. Run a query, see which brands get cited, and you know where you stand.
Not everyone is in line with this. Some people treat one check as the truth and build strategies, reports and tools on it. Others say AI answers are so random that tracking them is pointless. I tested which view is closer.
The hypothesis
Ask Perplexity the same question again, and it will give you the same top source more than half the time.
Why 50%? More than half is the lowest bar at which the same top source would be the usual result rather than the exception. For comparison, if Perplexity picked its top source at random from the pages it listed, it would match about 9% of the time. (To get this, I took each query’s two source lists, worked out the chance that one page picked at random from each list would be the same page, and averaged that across the queries.)
How I tested it
I selected 50 SaaS search queries, 25 informational and 25 commercial. Informational examples include “what is churn rate in saas”, “how to calculate customer lifetime value” and “what is product led growth”. Commercial examples include “best email marketing software”, “quickbooks vs xero” and “notion alternatives”. The list was fixed before the first search.
I ran every query on Perplexity by hand, using its default search (free plan) in a fresh incognito window each time. Every run used the same laptop and browser (Chrome). For each answer, I saved Perplexity’s own export, which lists every source in order and shows which ones the answer cites.
I did four runs:
- Run 1: 5 October
- Run 2: 5 October, a few hours after Run 1
- Run 3: 6 October, the next day
- Run 4: 12 October, a week later
Then I compared each later run with Run 1, query by query, on three measures:
- Same top source: was source one the same page?
- Listed sources in common: the share of listed sources the two runs had in common (sources in both runs ÷ all the different sources across both)
- Cited sources in common: the same, but only for the sources the answer cites with a numbered marker
What happened
Compared with Run 1:
| Hours later (Run 2) | Next day (Run 3) | A week later (Run 4) | |
| Same top source | 46% | 28% | 28% |
| Listed sources in common | 88% | 49% | 32% |
| Cited sources in common | 46% | 29% | 22% |
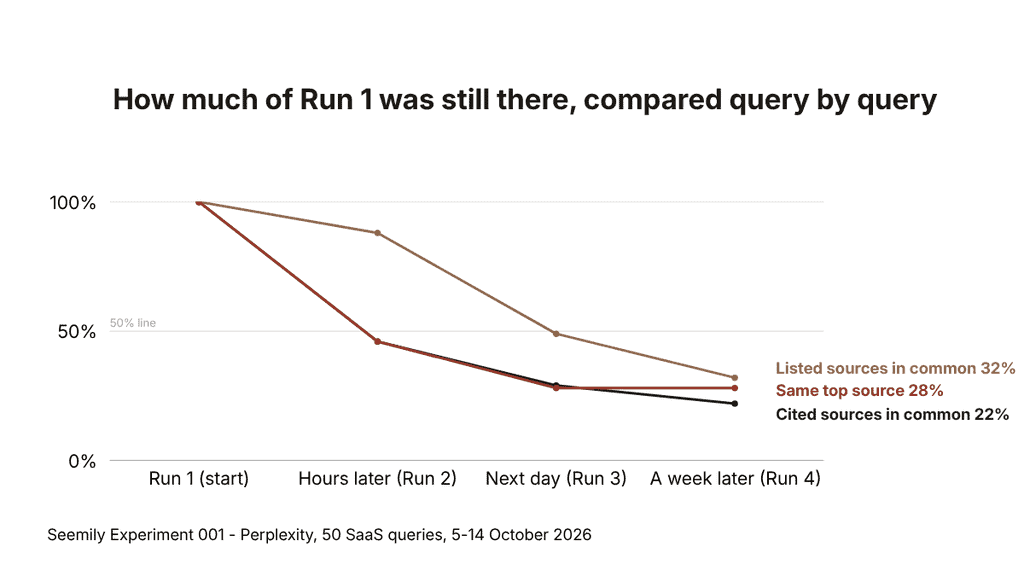
Within a few hours, the source list barely moved, but the top source had already changed for more than half the queries. By the next day, half the list had changed. By the end of the week, two-thirds had.
Counting by brand instead of exact page doesn’t change the story much. A week later, only 39% of the brands in the list were the same.
Across all four runs, the top source stayed the same for just 7 of 50 queries.
Here’s what that looks like for one query, “best email marketing software”. Its top source was Shopify in Run 1, Sequenzy a few hours later, ZDNet the next day and Forbes a week later which means four runs, four different top sources.
The top source moved most for “best” and “vs” queries
| Same top source as Run 1 | Hours later | Next day | A week later |
| Informational (“what is…”) | 60% | 32% | 40% |
| Commercial (“best…”, “X vs Y”) | 32% | 24% | 16% |
For commercial queries, the top source was the same as a week earlier only 16% of the time. If you sell software, these are the searches that matter most to you, and they’re the least stable.
Informational queries look odd: 60%, then 32%, then back up to 40%. With 25 queries in each group, one query moves the figure by 4 points, so that rise is just two queries. It’s most likely noise, not answers settling down.
The twist: same pages listed, different pages cited
Perplexity shows around ten sources under each answer, but the answer itself only cites a few of them, usually the first three to five.
That split matters. A few hours apart, the two source lists overlapped by 88%. The sources the answer actually cited overlapped by only 46%.
In other words, Perplexity listed almost the same pages both times, then cited different ones.
To be fair to Perplexity, this isn’t a like-for-like comparison. Cited sets are small, about four pages against about ten listed, and small sets overlap less just by chance. So I checked what pure chance would look like: if Perplexity picked which listed pages to cite at random, the cited sources would overlap by about 24%. (I simulated this: for each query, I picked the same number of pages at random from each run’s source list, 2,000 times over, and averaged the overlap.) The real figure, 46%, is well above that. Its choices aren’t random. They’re just much less stable than the list they come from.
It happened almost everywhere. In more than 8 in 10 queries, at least one source moved between “listed” and “cited” within a few hours: a page was cited in one run but only listed in the other, or the other way round. For “what is account based marketing”, Optimizely was cited in Run 1. A few hours later, it was still in the list but no longer cited.
For anyone tracking AI visibility, that’s the difference between being in the room and being quoted. A page can be listed in one run, cited in the next, and back to just listed after that.
What stayed and what changed
Across the four runs, Perplexity listed 973 different pages. Here’s how often each one showed up:
| Appeared in | Pages | Share |
| 1 run only | 390 | 40% |
| 2 runs | 215 | 22% |
| 3 runs | 184 | 19% |
| All 4 runs | 184 | 19% |
So there’s a small, steady core of pages that Perplexity keeps coming back to, and a large set that appears once and disappears.
What this means for you
- Never judge from one check. Check each important query at least five times over two weeks, and count how often you appear. “Cited in 3 of 5 runs” means something. “Cited once” doesn’t.
- Track listed and cited separately. Being in the source list and being cited in the answer are different results, and pages move between them all the time.
- Be careful with before-and-after claims. If you change a page and then see it cited, Perplexity may have cited it anyway. Without repeated checks before and after, you can’t tell your change from normal movement.
- Treat the top spot as temporary. For commercial queries (the “best” and “vs” searches), the top source changed in more than eight in ten within a week.
- Ask your tools how they measure. If an AI visibility tool reports one check per query, its numbers will swing on their own.
What this doesn’t prove
- Why the sources change. Some of the movement is random. Some may come from Perplexity updating its index, its model or its settings during the week. This data can’t determine that.
- Other engines. ChatGPT, Gemini and Google’s AI Overviews may be more stable, or less.
- Other topics and places. These are 50 SaaS queries, chosen deliberately for this test and all run from a single location. Results for other niches and countries may differ.
- The longer term. Four runs over a week show the trend. But the picture after a month could look very different.
- Exact-page matching. A regional copy of the same article counts as a different page. Counting by brand narrows the change only slightly.
- A small sample. One person, one week, 50 queries. Each query moves a percentage by 2 points, or 4 points within the informational or commercial group, so small differences shouldn’t be over-read.
What’s next?
I want to run the same consistency test on ChatGPT and Google’s AI Overviews, over a longer period, to see which engine is the most stable.
The data
The data includes every query, every run and every source, with its position and whether the answer cited it.

Get the Next Result Before Anyone Else
Twice a month I take one AEO claim and test it against a real sample of citations. You get the result and the dataset, straight to your inbox.
One email per experiment. No spam, unsubscribe anytime.